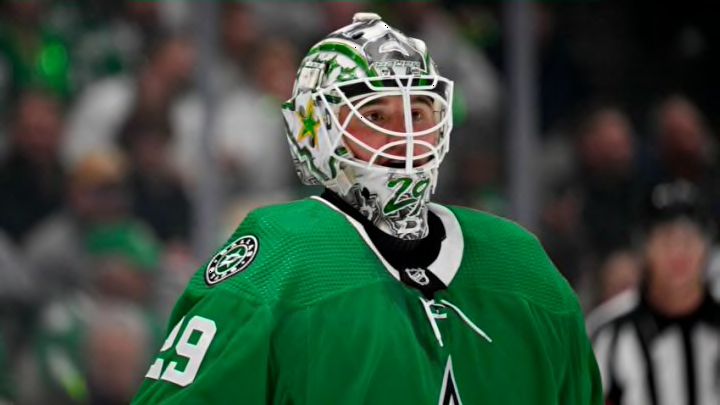
An area that I find to be most useful from the NHL Edge platform in its inaugural version has been the goaltender section. Specifically, we can look at Shots Against, Saves, Goals Against, and Save Percentage (Save %) in each of the designated ‘cut-off’ parts of the ice that offer us insights into where goalies are at their strongest and weakest. This tool could directly impact and assist opposing teams in on-ice preparation from tactical and decision-making perspectives (aside from other sophisticated private tools they likely use). Let’s use this tool to look at Jake Oettinger’s recent decline.
In Jake Oettinger’s case, this new wave of data available to the public can show us the context behind some of Oettinger’s inconsistencies. In light of a less-than-superstar season for the goaltender, I will analyze his NHL Edge profile to look for weaknesses. The main area of focus for this article is perimeter shots on Jake Oettinger’s “Save Locations” graph.
First, there is a noticeable dark zone on each side of Jake Oettinger’s Save Locations graph that touches the boards and goes down towards the goal line on either side. From Oettinger’s POV, his ‘blocker side’ wall ‘zone’ Save % is 0.960, which is darker than all surrounding zones.
That zone is darkened to demonstrate it being ‘below league average’ statistically. The Save % itself is misleading because 0.960 is a great Save % in most situations, but the issue is that this specific zone on the ice is a low-danger zone where 0.960 is ‘below league average’.
Furthermore, Oettinger’s ‘glove sideboards’ spot is at 0.923 and is especially dark compared to any other zone on the graph, meaning that this Save % is well ‘below league average’. While Oettinger has only given up one goal from his far blocker side and two goals from his far glove side, his save locations map demonstrates that most NHL goalies do not give up any goals from those low-danger spots.
This suggests that opposing NHL teams should shoot more from those “tough” angles because Oettinger isn’t perfect in those weaker areas, regardless of his many strengths in the mid-danger and high-danger shooting areas.
From a technical standpoint, we might be able to diagnose Jake Oettinger’s issues with those wide-angle shots from Oettinger being a large NHL goaltender. Jake Oettinger is 6’6”, and no matter how athletic one gets, there are weaknesses because of this height.
To be clear, being a tall goaltender has strengths, where he can cover most of the net without much effort, turn into a ‘wall’ in the butterfly position, and Oettinger doesn’t have to play an overly acrobatic, tiring playstyle like 5’11” Juuse Saros in Nashville does to succeed. On the negative side, shots from certain areas become almost unsavable for tall goalies like Oettinger where bending his pads sometimes opens gaps near each post. This could explain those numbers above.
This reminds me of a 2022 article by David Castillo where Castillo mentioned that a younger Oettinger struggled with shots in tight. Being a 6’6” goalie and having to crouch into a “post-tight” position or maneuver up and down quickly is not as easy for these tall goalies. As Oettinger matures as a star-calibre NHL goaltender, he will learn about where he’s getting ‘exposed’ and I’m sure he will do his best alongside goalie coach Jeff Reese to practice and ameliorate as an athlete for these awkward post issues.
Keep in mind that every NHL goalie’s data is available in the NHL Edge platform, so we could do this for every NHL goaltender and find out any NHL goalie’s unique statistical flaws.
All in all, looking at Goalie leaderboards on sites like Moneypuck.com, it may be surprising to not see Jake Oettinger in the top 10 for goalie stats like “Goals Saved Above Expected” (GSAx). On Moneypuck.com, at 5v5 (the most important hockey setting), Oettinger is ranked 55th out of 64 goalies with -3.6 GSAx (min. 5 games) and 55th in Wins Above Replacement (WAR) with -0.6 WAR.
For reference, Scott Wedgewood is 20th with 2.3 GSAx and 0.38 WAR, and Thatcher Demko leads the league with 9.6 GSAx and 1.59 WAR respectively. On NaturalStatTrick.com, Oettinger is ranked 40th of 53 goalies to have played 300 minutes in Goals Saved Above Average (GSAA) with -3.16 GSAA.
Strictly using these advanced statistics, Jake Oettinger has provided below-average goaltending so far this season for the Stars, but we all know what he’s capable of. I hope Jake Oettinger maintains confidence despite the tough-ish start to his season.
If I’m Oettinger and the Stars, I want to learn about my tendencies when trying to save shots from these ‘weaker’ areas to improve as a goaltender and overall athlete. Data-driven decision-making can help in these situations where Oettinger and team staff can diagnose problems that may not always be obvious without the stats from a platform like NHL Edge.
As a goalie, learning about your ‘weak spot’ can be the reason you keep your starting job in the NHL. I’m sure there are hardly any worries from the Dallas Stars organization at this time regarding Jake Oettinger, but this statistical analysis, led by NHL Edge findings, does demonstrate where Oettinger is inconsistent and where he may get exposed in the future. All the best to Jake Oettinger this season.
